A Bitter Pill to Swallow
The unknown American crisis… and what we’re going to do about it!
The Prescription Drug Market in America
In the last thirty days, 7 in 10 American adults have taken some form of prescription drug. If this number is surprising, think of the everyday conditions these medicines are used to treat- from an injectable drug for controlling diabetes, to once daily pills managing chronic conditions like high blood pressure, high cholesterol, heart arrhythmias, anxiety, thyroid conditions, etc. Medical advances in prescription pharmaceuticals, along with our ability to diagnose their associated health conditions, contributes heavily to the improved lifespans expected in a first world economy today. If grandpa lowers his risk of a heart attack, and thereby extends his life by decades, taking a pill everyday becomes a literal cost of living. And don’t we, as a society owe the American public reliable access to these quality medicines?
It is for that reason the U.S. population relies heavily on prescription drugs. So much so, that for Americans between the ages of 65 and 79, a whopping 87% are currently taking at least one prescription drug, and the average fills 20 prescriptions per year . Of course, these numbers on an individual level add up on a national scale. Annually, the American public fills 5.8 billion prescriptions at a total cost of $359 billion . Considering our aging population, this total is expected to climb much higher, reaching $560 billion per year by 2028. As large as this price tag is, without generic drugs this figure would be nearly double. In 2019, the U.S. saved $313 billion by using generic drugs . It’s no wonder, 90% of all prescriptions in the U.S. are filled by generics . Considering this, it could be expected the money we spend on generics far outweigh branded drugs, but those just aren’t the facts. Generics only account for 20% of prescription costs. The availability of generic drugs stretches precious healthcare dollars, making generic medicines broadly accessible to the American public.
The Rise of the U.S. Generics Manufacturing Base
In 1984 a piece of groundbreaking legislation called the Hatch-Waxman Act was passed, creating a formal approval process for drug manufacturers to make generic forms of expensive branded drugs. With this new law, drug companies only had to prove (for the most part) the generic drugs they seek approval for are formulated with the same ingredients and are absorbed within the body at a similar dosing range as the branded drug they are formulated to copy. This created a pathway for companies to avoid expensive clinical trials and years of research and development costs, offering medicines at a steep discount to the American public. The Hatch-Waxman Act has been a tremendous boon for patients and healthcare systems alike. Fueled by a demand for lower cost alternatives, and a push to expand access to affordable, life sustaining drugs to treat chronic conditions, the U.S. pharmaceutical landscape experienced a period of rapid growth, expanding the U.S. pharmaceutical industrial base and a local, proven source of supply.
By the 1990’s and early 2000’s, a fabric of both large and medium sized generic manufacturing facilities flourished across the United States, all under the watchful eye of the U.S. Food and Drug Administration (FDA) who performed routine inspections of these facilities required by U.S. law to take place at a minimum of once every two years. In many cases, visits from FDA occurred much more frequently, since these sites were located within FDA enforcement districts right in their backyard.
Principle among this fabric of U.S. pharmaceutical sites were very large producers of Oral Solid Dosage (OSD) generics in the form of pills, tablets, and capsules. Easy to take and easy to administer, OSD generics are the most commonly prescribed dosage form. Principle among the larger sites operating at near full capacity between 2000 – 2010 include:
- Corona, CA: Watson Pharmaceuticals facility supplying approximately 6 billion units per year
- Broomfield, CO: Sandoz (Novartis subsidiary) facility supplying approximately 9 billion units per year producing over 150 different medicines and strengths.
- Wilson, NC: Sandoz (Novartis subsidiary) facility supplying approximately 4 billion units per year.
- Forest, VA: Teva Pharmaceuticals site producing approximately 3 billion units per year, including difficult to control, narrow therapeutic medicines.
- Salt Lake City, UT: Teva Pharmaceuticals site producing approximately 4 billion units per year.
- Morgantown, WV: Mylan. The daddy of them all, producing 20 billion units per year. The largest single producing site of OSD generics in the world.
These are just a few of the larger facilities. Several others with output levels in the range of 1 – 2 billion units per year bolstered U.S. generics production across central New Jersey, New York, the Carolinas and Midwest and upper Midwest.
The Commoditization of Generics
The barrier to entry into the U.S. generics market for any pharmaceutical company is to submit a detailed application to the U.S. Food and Drug Administration (FDA). The FDA reviews the applicant’s data, manufacturing processes, control plans and facility licenses. If the proposed product is found to perform similarly to the name brand drug, (and appears to have been manufactured under basic quality standards), the final hurdle is to achieve a successful inspection of the proposed manufacturing site by highly trained FDA investigators.
Once approved, generic drugs are purchased through a network of wholesalers and group purchasing organizations (think Walgreens, McKesson, ExpressScripts, etc) based on a complex schema of list prices and rebates, secretive agreements between insurers and Pharmacy Benefits Managers (PBM’s). By the time these pills make it to your prescription bottle they have been packaged, re-packed and dispensed through multiple companies and varying levels of the global pharmaceutical supply chain. So how do you know where grandpa’s heart medications are made, you may ask? The honest answer is that even if you think you do, you don’t. At the consumer level, you may think that if you look closely there is a label on your pill bottle that names the manufacturer. But what is in a name? You can look them up and find a U.S. business office address and an American sounding name, but don’t let that fool you. More about that in a moment. But let’s not forget that there continue to be high quality producers of generic drugs, whose products save and sustain lives every day, all the while minimizing the financial burden to society.
The fundamental problem is that average American knows little to nothing about where that pill is coming from, and under what conditions it was manufactured and at what quality. Once a product is approved, there’s nothing to differentiate one tablet from another. The only difference readily apparent to you is how much the co-pay is. And in a market where the only factor for competition is price and rebate structure, the lowest cost product that can be reliably supplied wins. And the company that finds a way to produce drugs at a lower cost gains market share leaving, behind those that can’t compete in a race to the bottom. Welcome to the global generic pharmaceutical commodity market.
Over the past 20 years, generic pharmaceutical companies have been challenged with lowering their cost per unit, finding a better way to the bottom of the cost curve. The race to the bottom is fueled by shareholders of publicly traded healthcare companies, who expect the quarter over quarter growth in profitability needed to show a return on their financial investment. The decision then for manufacturers is to invest tens (and in some cases hundreds) of millions of dollars into innovation and new technology, opening up their drug applications to FDA scrutiny and hopefully approval down the road. Time and money with no guaranteed outcome. Alternatively, they could save themselves the trouble of innovating and optimizing processes by transferring production to a cheaper overseas labor force, many times in second and third world countries like India, China, Asia and Eastern Europe. In Bangalore, India for example, the average manufacturing worker makes the equivalent of $1.55 per hour compared to that union job in middle America, making $20 per hour. The math becomes simple and easy.
Impact to the U.S. Pharmaceutical Manufacturing Base
Since the early 2000s, a wave of mergers and acquisitions has swept across the broader pharmaceutical landscape. A few examples, Watson-Activis-Allergan-AbbVie; Pfizer-King-Hospira-Allergan-Mylan; Teva-Actavis-Barr-Ivax-Novopharm; and many, many others. Considering the commoditization of generics, many of the top global pharmaceutical companies producing both innovative branded and unbranded generics sought to shed their generics production capacity (e.g. Novartis). At the same time, a move was afoot in India. Due to their low manufacturing cost base, India became a perfect landing spot for consolidation within the generic pharmaceutical production sector. Today, production of generic medicines in India dwarfs American capacity. There are currently over 20,000 registered drug manufacturing sites in India.
Remember those large volume U.S. producers listed above? What happened to them:
- Corona, CA: the former Watson facility exchanged hands in mergers with Activis and Allergan. Currently the facility of owned by a Chinese company and is used for primarily R&D. Closed to commercial generics manufacturing. (6 billion units to 0 per year).
- Broomfield, CO: Owned for decades by Sandoz (a division of Novartis), the facility was shut down in 2018 and is currently owned and operated by a CBD manufacturing. Closed to commercial generics manufacturing. A proposed purchase by Indian firm Aurobindo fell through in 2019. (10 billion units to 0 per year).
- Wilson, NC: Owned for decades by Sandoz (a division of Novartis), the attempted sale to Indian firm Aurobindo fell through in 2019. The site is continuing to produce generics under the Sandoz banner. (4 billion units to approximately 2.5 billion per year currently).
- Forest, VA: The site did not survive the Actavis-Allergan mergers and management. It is currently closed. (3 billion units to 0 per year).
- Salt Lake City, UT: A small-to-medium producer of generics, the site has survived the Teva-Activis-Allergan mergers, currently operating at a reduced capacity. (4 billion units to approximately 2 billion per year).
- Morgantown, WV: The former Mylan facility was acquired in a merger with Pfizer, forming a company called Viatris. The facility closed July 31, 2021. (20 billion units to 0 per year).
As for the network of smaller generics producing sites, a few still operate at low capacities (approximately 1 billion units or less). Many are now owned by Indian-owned companies or remain producing specialized controlled substance drugs that cannot be manufactured overseas due to U.S. Drug Enforcement Agency (DEA) controls for these products. Consider the comparative maps below.
Generic OSD Manufacturing Locations and Approximate Production Volumes Per Year
These maps show how the scale of production capacity shifted between the U.S. and India due to underlying market dynamics — comparing the 1990’s to today.
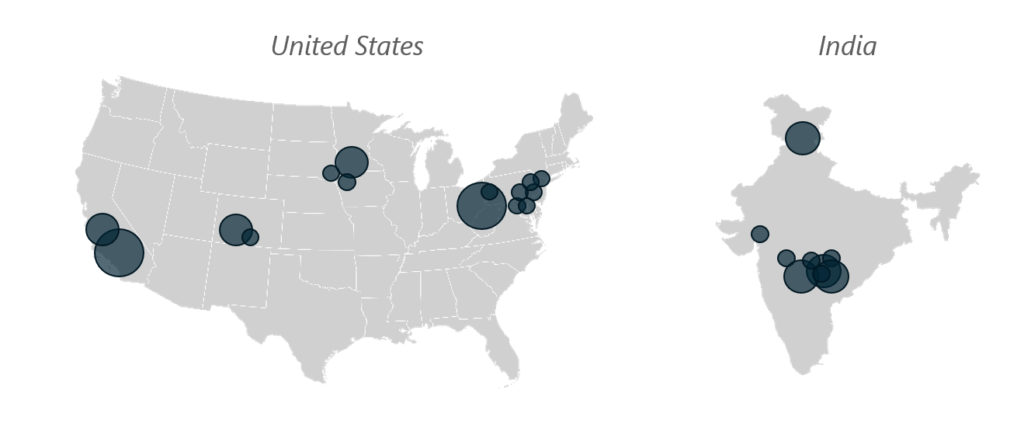
Figure 1, Generic OSD Manufacturing Locations and Approximate Production Volumes Per Year – 1990’s
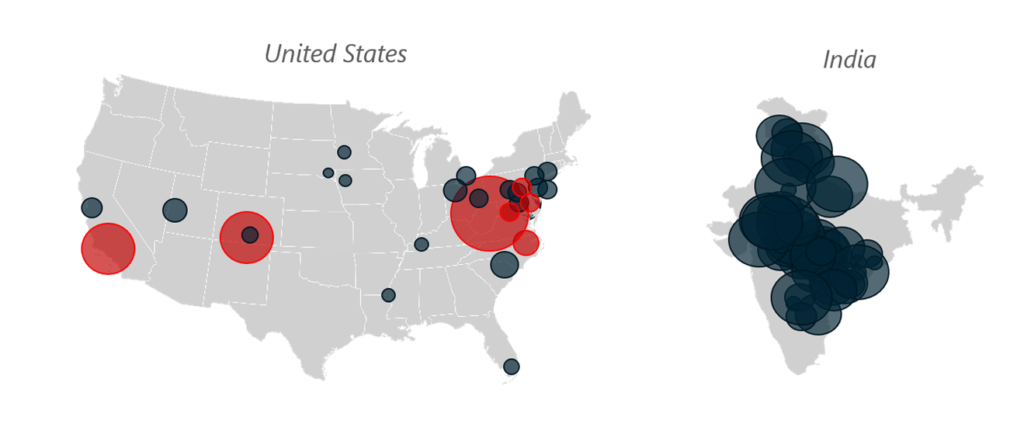
Figure 2, Generic OSD Manufacturing Locations and Approximate Volumes – 2021
Key: GRAY shading indicates facilities in operation, whereas RED shading shows closed facilities. Scaling by location size indicates production volumes between 1 billion to 20 billion units per year.
Impact to Product Quality
As market dynamics drove the commoditization of generic drugs and its expansion of production in low labor cost markets, the U.S. FDA struggled to keep up with inspections across growing armada of overseas facilities. The lack of capacity to inspect foreign facilities represented a perceived enforcement disparity between U.S. and rest of world production plants. While in the U.S. federal regulation mandated a thorough FDA inspection at a minimum of once every two years, there was no similar standard for foreign facilities. Those that received initial site approval inspections could expect few follow-up inspections afterward.
To address the gap, the Generic Drugs User Fee Amendments act was passed by Congress in 2012. This legislation provided a user fee schedule to be paid by companies submitting drug applications for FDA review, creating a new source of funding and resources to FDA. With these resources, the FDA committed to publish standard time frames to complete application reviews, and even more significantly, to create a level playing field for oversight inspections between U.S. and foreign facilities by 2017. While great strides have been made improving parity of oversight, of the 965 drug manufacturing facilities targeted for inspection in 2016, only 49% of these facilities had been inspected by fiscal year 2019 . How is it possible for foreign companies to import drugs manufactured in foreign facilities without an FDA approval inspection, you may ask? The answer is an increasing dependence on accepting overseas regulatory partner agency inspections to modulate the facility risk calculus and justify delaying or waiving a required approval inspection by U.S. FDA. The legal mechanism used to support this practice is through a growing list of mutual recognition agreements (MRAs) between the United States and partner countries. Since the first MRA between the U.S. and U.K. in 2017, this list of MRAs has expanded to include a total of 28 countries. from the U.S. and U.K. 2017, the list of with agencies 28 European countries.
In comparing outcomes for FDA inspections of foreign facilities which have so far taken place, data show that 17% of inspections of Chinese facilities result in unacceptable outcomes, with a similar 10% unacceptable rate for Indian facilities. In comparison with the outcomes for FDA inspections of facilities on the U.S. mainland, these figures represent a 140% and 40% increase in unacceptable outcomes for China and India, respectively. Consider the sourcing data below for several of the most commonly prescribed, generic drugs and their predominant sourcing locations below.
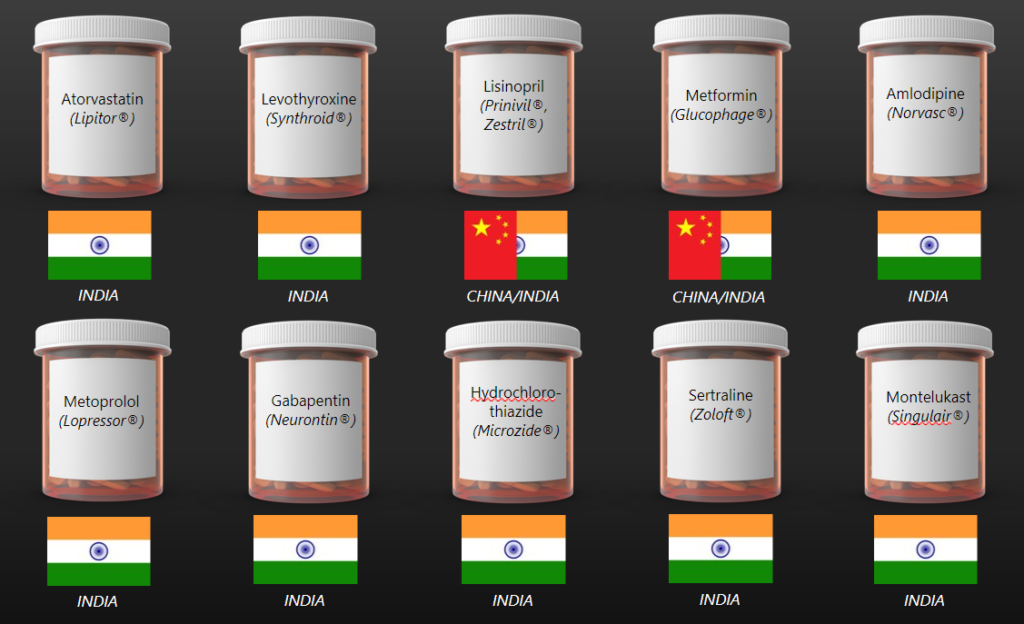
Figure 3, Geographical location of the majority of approved sites per product
A recent study published in August 2020 involved analytical testing of difficult-to-make finished dosage form pharmaceutical products, comparing relevant performance of these drugs as manufactured across global geographies. In all, 252 drug products (including 217 generics) marketed in the U.S. were tested by an independent laboratory. The summary findings indicated that all products met their relevant release criteria for acceptable usage per U.S. specification requirements. However, it is notable that Indian manufactured products showed the lowest statistical performance for the dissolution testing parameter when compared to the other regions (Canada, Europe and the U.S. manufacturing sites). The dissolution testing parameter is intended to model the availability of the drug’s active ingredient, as absorbed by the human body.
These data illustrate that the global pharmaceutical generics manufacturing industry, in the vast majority of cases, conducts manufacturing activities in compliance with U.S. laws and regulatory requirements to produce drugs that meet U.S. acceptance criteria. However, the data for inspection outcomes and product surveillance testing demonstrate that medicines produced in India and China represent greater risk to the U.S. patient.
Supply Implications to the U.S. Strategic Stockpile
Active Pharmaceutical Ingredients
During testimony to Congress on October 30, 2019, the Director of the Center for Drug Evaluation and Research at the FDA, Dr. Janet Woodcock testified that 78% of active pharmaceutical ingredients (APIs) used to supply the U.S. market were sourced from overseas suppliers, with 13% coming from China . As alarming as this number is, it is based on APIs imported into the United States for production at U.S. facilities. You may ask that considering >95% of our OSD generics are sourced from outside of the U.S. and predominantly India and China, the percentage of Chinese and Indian APIs used in manufacturing products sold and distributed within the U.S. must be much, much higher right? You would be of course correct, but this data is not readily available as FDA only ensures APIs used in products approved for distribution within the United States are manufacturing using approved API suppliers, regardless of geography- and therefore does not likely have access to data showing volumes of API usage by source country or approved supplier. For antibiotics, the reliance on foreign suppliers for APIs is even higher at 97%.
But even if we were to turn a switch and start producing critically necessary APIs within U.S. based manufacturing facilities could we, and would we want to? The answer on both counts is YES, with an rather important “however,”. Many of the production processes used to source key starting materials for these APIs, as well as the API production processes themselves use large quantities of chemicals and solvents (many of them cancer causing) as well as large scale pollution sources which cannot be produced per current processes, in compliance with EPA and ethical standards. Estimates for CO2 emissions associated with the Chinese pharmaceutical industry indicate annual emissions of 56 metric tons, based on 2016 data .
The only responsible way to address the API sourcing issue in the long term is for the U.S. to invest in improvements to API production technologies using modern innovation to significantly reduce environmental impact of API production on the global environment. In the short term, pharmaceutical manufacturers can use an approach called dual sourcing, whereby a company qualifies and contracts with multiple API manufacturers to reduce dependency on any one source. This can be done strategically by using U.S. manufacturers where possible, while leveraging source companies located in varying geographies and political alliances (i.e., eastern Europe) to hedge against dependence on foreign suppliers, particularly China. This would be the strategy favored by American Medicines Company. This may not be the cheapest sourcing model, but it is by far the more ethical one which mitigates risk to the American patient.
Finished Dosage Forms
As challenging as the API situation would seem to be, from a strategic supply perspective, the risk of impact to the American consumer posed by our dependence on foreign generic OSD finished goods manufacturing is of much greater risk and impact. This may not be intuitively obvious but let’s discuss why. Active pharmaceutical ingredients (APIs) for solid oral dosage generic medicines are solid crystalline powders. They are typically stored in fiber or plastic drums and have a proven shelf life of 5 years or greater. The average finished dosage form however, typically has a demonstrated stability through 24 months. Also, stability of an API is influenced by chemical decomposition reactions over time and upon exposure to certain conditions like high temperatures and in some cases oxidation reactions. But again, almost all generic OSD APIs show very stable profiles and long available storage times, with few notable exceptions. Conversely, finished dosage form stability depends on many more factors than APIs. Not only are finished dosage forms more susceptible to chemical decomposition due to interactions within a matrix of active and inactive ingredients present in pills, tablets and capsules, they also are susceptible to physical deterioration which impacts the drug’s ability to deliver the right dose to patients.
Availability of APIs is a matter of concern for pharmaceutical manufacturers since they can’t make their finished dosage products without APIs. Since these ingredients have a much longer available shelf life, their storage costs are much lower when amortized across the useful life of the materials. And carrying a higher inventory of APIs versus finished dosage forms alleviates risk to ongoing manufacturing in the face of availability concerns. As a general rule, most pharmaceutical manufacturers carry at least 3 months of API inventory and 6 to 12 months on average. However, since finished goods carry further embedded costs of all the manufacturing steps needed to produce them, and are of limited benefit to hold in inventory against a shorter shelf life, most companies have instilled varying forms of just-in-time (JIT) inventory control plans to reduce carrying finished goods as much as practicable, while balancing the needs to have materials on hand for ensuring order fulfillment.
But the American consumer doesn’t use APIs directly. They need finished product. The most frequently prescribed drugs in the U.S. are typically prescribed in seven-day to three month allotments. Considering the tendency by manufacturers to use JIT inventory planning, how many three month allotments are held in reserve within the global supply chain for critical, life sustaining drugs used by Americans every day? The answer is that we just don’t know. Amongst today’s pandemic, combined with our nearly exclusive reliance on foreign suppliers like India and China, this should frighten us all. Indeed, President Biden’s Executive Order 1407 issued this past February and the resulting 100-day report published June 8, 2021, build upon President Trumps Executive Order 13944 to focus on steps the Federal Government is taking to revisit our national pharmaceutical stockpile, partnering with pharmaceutical manufacturers to do so.
While we don’t directly know how much of our critically needed medicines used to treat chronic conditions exists at any one time within the global supply chain, under certain scenarios it may not matter much at all. Consider April 2021, during the height of the pandemic India unilaterally banned exports of an OSD drug called Remdesivir, an anti-viral used to stop COVID-19 in its tracks . We can’t really blame India. At the same time, the country was dealing rampant infections sweeping across the country, and arguably limiting their work force to produce all the other drugs we Americans use and need. But if one country, when challenged with a growing pandemic, can instantly cutoff the global supply of medicines, we are all at risk. And what if the issue isn’t a pandemic? What if a large plant in any one country, critical to the global supply of medicines due to consolidation, is brought off-line by a natural disaster such as a cyclone, hurricane or earthquake? Consider further geopolitical interests of our dependence on India and China for generic OSDs as discussed earlier.
From a business perspective, the leading Indian multi-national pharmaceutical companies are rapidly reaching saturation market in generics. The same cost focused market dynamics are still in play, which further the race to the bottom amongst the competitive Indian landscape and the markets they supply. We are already seeing a shift in focus from small molecule generic medicines to more margin friendly products such as biosimilars and specialty drugs. And there is anecdotal evidence from quiet conversations with leaders within these companies that the next low-cost centers reside in eastern and southern Asia; places like Bangladesh, Malaysia, Vietnam and others. Offshoring from India to these other Asian countries follows the same playbook that has been driving our industry for the past two decades.
Recommended Reading
- The Great American Drug Deal: A New Prescription for Innovative and Affordable Medicines, Peter Kolchinsky, January 17, 2020.
- “Our Drug Supply is Sick. How Can We Fix It?”, Farah Stockman, New York Times Opinion, September 18, 2021.
- U.S. Executive Order 1407 on America’s Supply Chains, February 24, 2021.
- 100 Day Report, Executive Order 1407, June 8, 2021
- “Quality Testing of Difficult-to-Make Prescription Pharmaceutical Products Marketed in the US”, Fischer et al, JAMA Network/Open 2020.
Contact us at: info@americanmedicinescompany.com